
Class 11PhysicsOscillationsDifferent types of oscillations (Free, Damped, Forced Oscillation and Resonance)
EasyWhich of the diagrams shown in the figure represents the variation of the total mechanical energy of a pendulum oscillating in water as a function of time?
- A
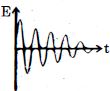
- B
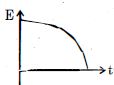
- C
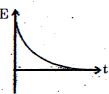
- D
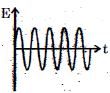
Explore More
Similar Questions
$A$ $3 \ kg$ sphere dropped through air has a terminal speed of $25 \ m/s$. (Assume that the drag force is $F_d = -bv$). Now suppose the sphere is attached to a spring of force constant $k = 300 \ N/m$,and that it oscillates with an initial amplitude of $20 \ cm$. What is the angular frequency of its damped $SHM$? ..... $rad/s$
Medium
View SolutionThe amplitude of vibration of a particle is given by $a_m = \frac{a_0}{a\omega^2 - b\omega + c}$,where $a_0, a, b,$ and $c$ are positive constants. The condition for a single resonant frequency is:
Medium
View SolutionFor a damped harmonic oscillator governed by the equation $m \frac{d^2x}{dt^2} + b \frac{dx}{dt} + kx = 0$, find the time $t$ after which the mechanical energy becomes half of its initial maximum value.
DifficultAIIMS 2019
View SolutionIf the amplitude of a damped harmonic oscillator becomes half of its initial amplitude in a time of $10 \ s$, then the time taken for the mechanical energy of the oscillator to become half of its initial mechanical energy is (in $s$)
What is pure simple harmonic oscillation? Why is it not $100 \%$ possible in practice?
Medium
View SolutionVedclass Products
For Students
Vedclass Test Series
Mock tests in real JEE/NEET style with performance analysis. 5-day free trial.
Start Free TrialFor Teachers
Exam Paper Generator
Generate Set A/B/C/D exam papers from 7.5L+ questions in 2 minutes. 3 chapters free.
Try FreeFor Institutes
Online Exam Module
Live online exams with unlimited students, 360° analytics & white-label branding.
See Demo